Monitoring vLLM Inference Servers: A Quick and Easy Guide
Running vLLM in production without proper monitoring is like flying blind. You need visibility into request latency (P50, P95, P99), token throughput, GPU cache usage, and error rates to optimize performance and costs. This step-by-step guide walks you through building a complete observability stack using Prometheus and Grafana—the same tools used by companies like Uber, GitLab, and DigitalOcean. In 10 minutes, you'll have professional dashboards tracking 8 key metrics that matter for LLM inference performance. 💡 **Perfect for:** MLOps engineers, platform teams, and anyone running vLLM servers who wants production-ready monitoring without the complexity.


Monitoring vLLM Inference Servers: A Quick and Easy Guide
Learn how to set up comprehensive monitoring for your vLLM deployments in minutes using Prometheus and Grafana
Introduction
Monitoring your vLLM inference servers is crucial for maintaining optimal performance, understanding usage patterns, and ensuring reliability in production. Whether you're running vLLM on RunPod, local infrastructure, or cloud platforms, having proper observability gives you insights into request latency, throughput, resource utilization, and system health.
In this guide, I'll walk you through setting up a complete monitoring stack for vLLM using Prometheus and Grafana - the industry-standard tools for metrics collection and visualization. This setup will give you professional-grade monitoring capabilities with minimal configuration effort.
What You'll Monitor
Our monitoring stack tracks the essential metrics that matter for vLLM performance:
🚀 Core Performance Metrics
- Request Rate: Track successful and failed requests per second
- End-to-End Latency: Monitor P50, P95, and P99 response times
- Token Throughput: Measure prompt and generation tokens processed per second
- Active Requests: See current workload in real-time
💾 Resource Utilization
- GPU Cache Usage: Monitor memory utilization percentage
- System Health: CPU, memory, and disk usage tracking
🔍 Operational Insights
- Error Rates: Identify and troubleshoot failed requests
- Model Performance: Compare performance across different models
- Capacity Planning: Understand usage patterns for scaling decisions
Architecture Overview
Our monitoring stack consists of three main components:
Our monitoring stack consists of three main components:
┌─────────────────┐    ┌─────────────────┐    ┌─────────────────┐
│   vLLM Server   │    │   Prometheus    │    │    Grafana      │
│   (RunPod/Cloud)│◄───┤   (Scraper)     │◄───┤   (Dashboard)   │
│                 │    │                 │    │                 │
└─────────────────┘    └─────────────────┘    └─────────────────┘
         │                       │                       │
         │                       │                       │
    /metrics endpoint      Stores metrics         Visualizes data
- vLLM Server: Exposes metrics via
/metricsendpoint - Prometheus: Scrapes and stores time-series metrics data
- Grafana: Creates beautiful dashboards and visualizations
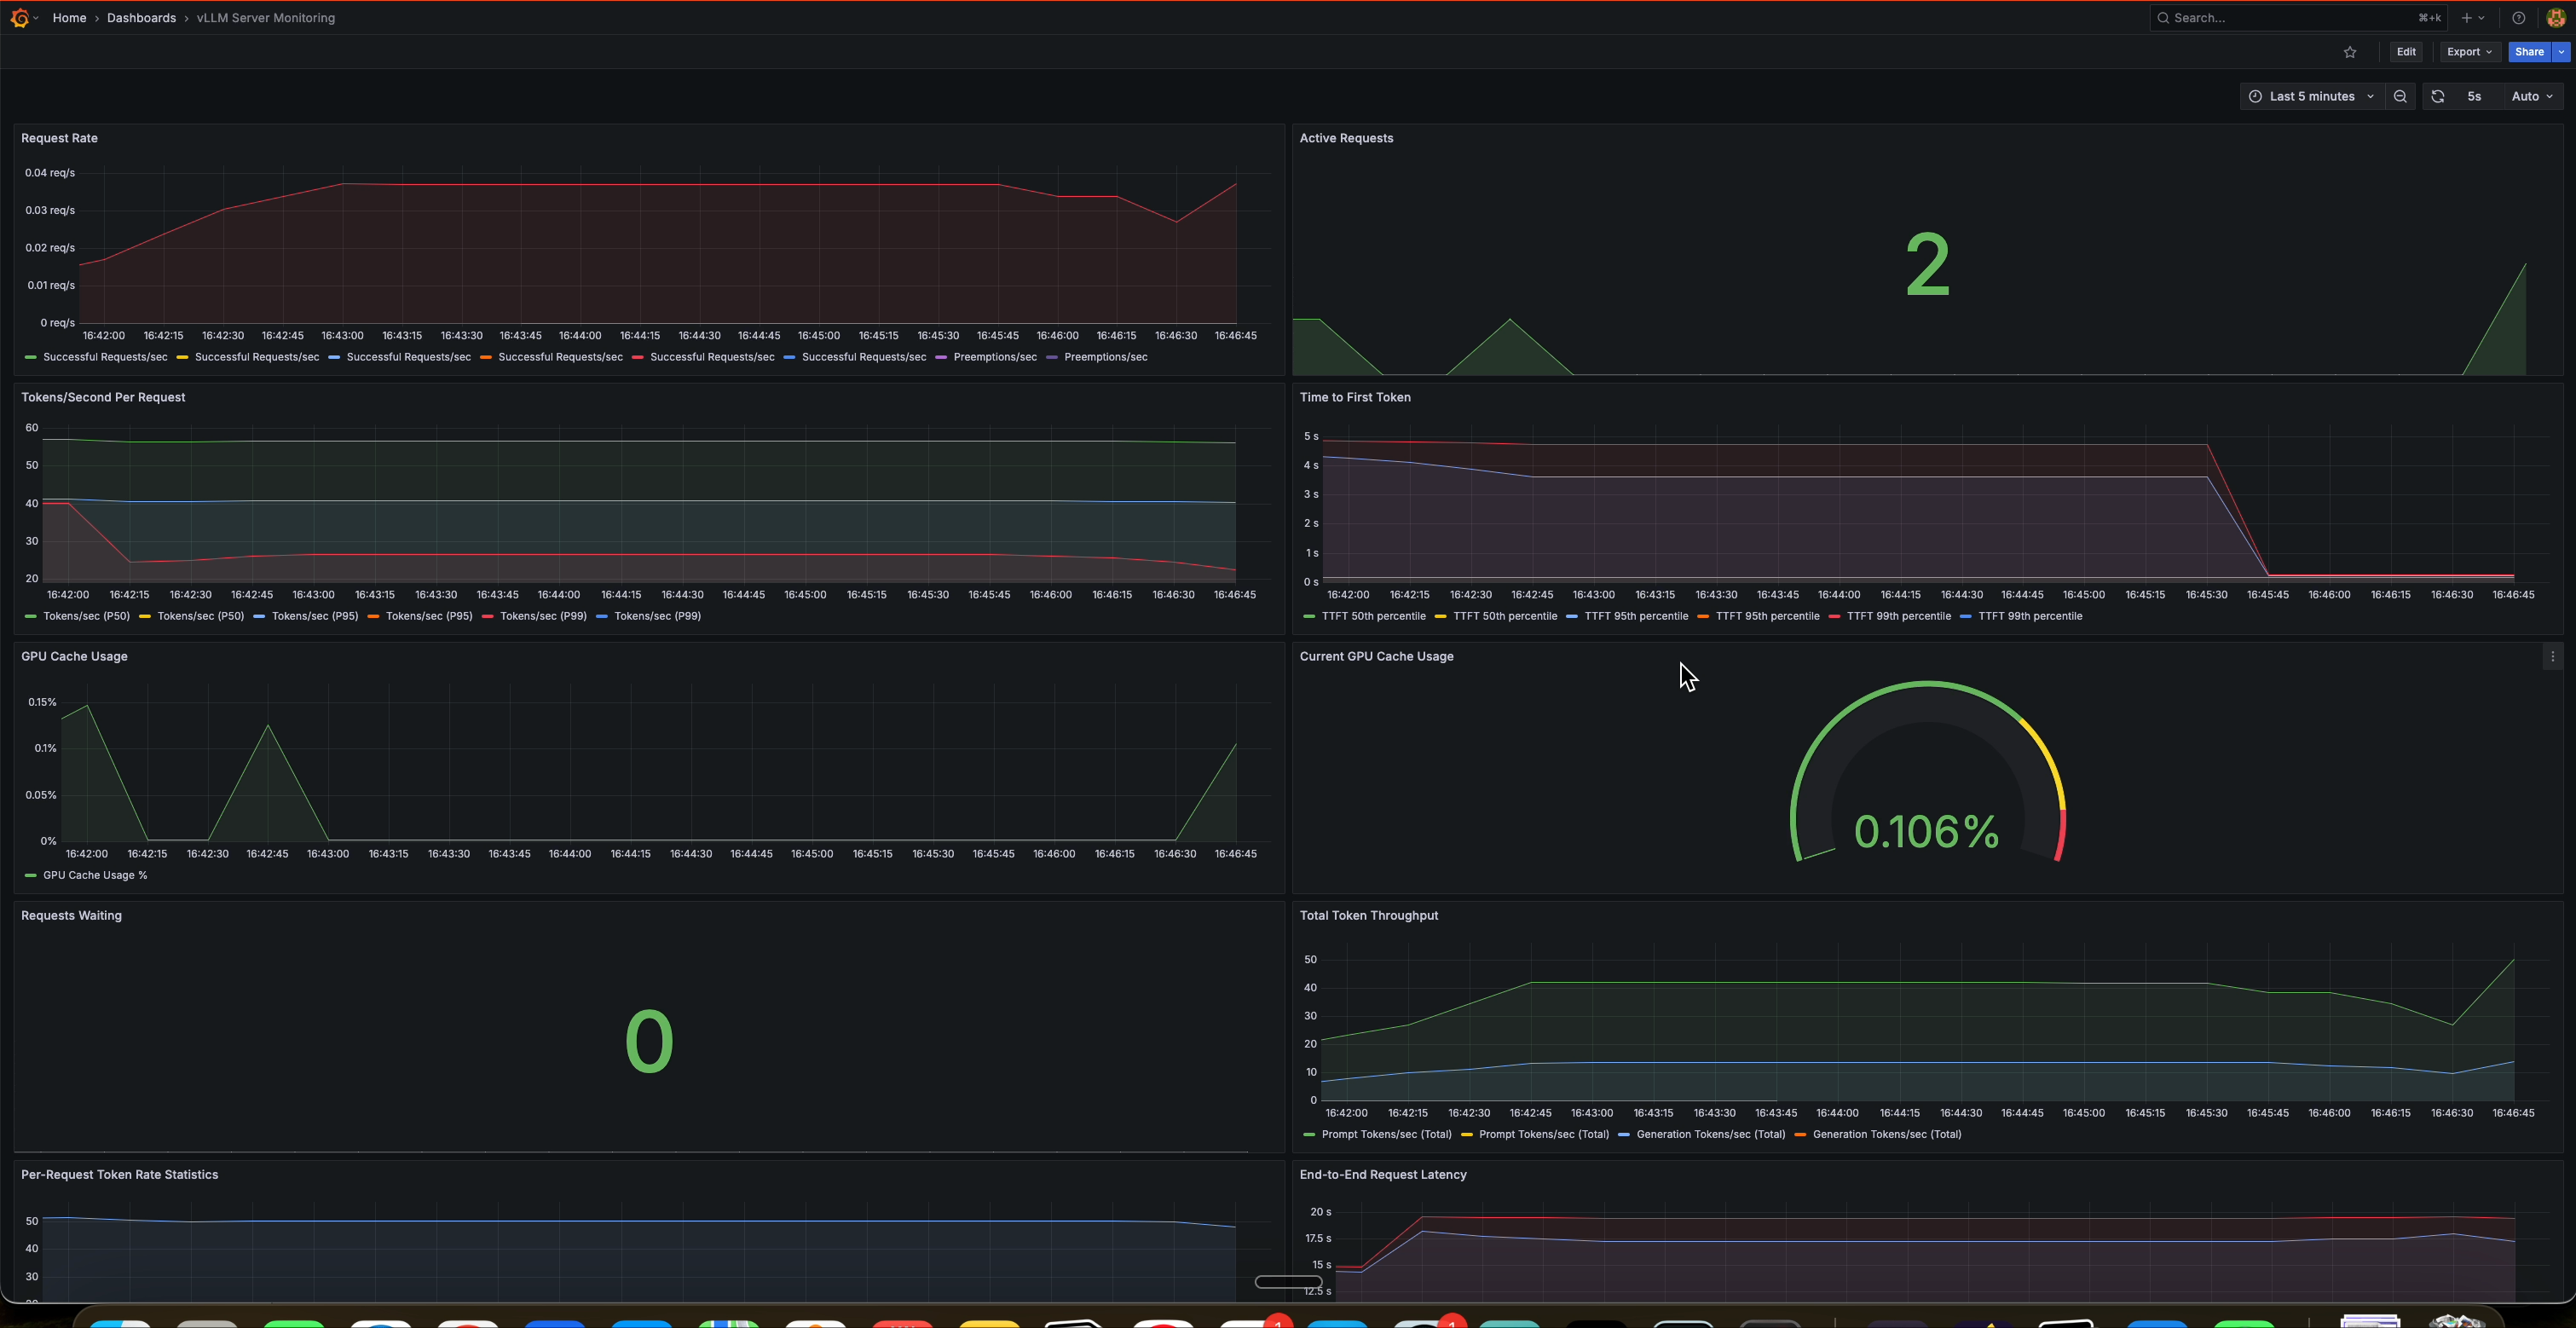
Monitoring Dashboard
This is the expected monitoring dashboard you will get at the end for your vLLM server :
Quick Setup Guide
Prerequisites
- Docker and Docker Compose installed
- A running vLLM server with metrics enabled
- Basic familiarity with environment variables
Step 1: Project Structure
Create the following directory structure:
monitoring/
├── prometheus/
│   ├── prometheus.yml
│   └── rules/
├── grafana/
│   ├── provisioning/
│   │   ├── datasources/
│   │   │   └── prometheus.yml
│   │   └── dashboards/
│   │       └── dashboard.yml
│   └── dashboards/
│       └── vllm-dashboard.json
├── docker-compose.monitoring.yml
├── monitoring.env
└── start-monitoring.sh
Step 2: Configure Environment Variables
Create monitoring.env with your vLLM server details:
# RunPod/Cloud vLLM Server Configuration
VLLM_ENDPOINT=your-endpoint.proxy.runpod.net
VLLM_PORT=443
VLLM_PROTOCOL=https
VLLM_API_KEY=your-api-key-here

# Monitoring Configuration
PROMETHEUS_PORT=9090
GRAFANA_PORT=3000
GRAFANA_ADMIN_USER=admin
GRAFANA_ADMIN_PASSWORD=admin123

# vLLM Metrics Configuration
VLLM_METRICS_PATH=/metrics
Step 3: Prometheus Configuration
Create monitoring/prometheus/prometheus.yml:
Step 4: Grafana Configuration
Create monitoring/grafana/provisioning/datasources/prometheus.yml:
apiVersion: 1

datasources:
  - name: Prometheus
    type: prometheus
    access: proxy
    url: http://prometheus:9090
    isDefault: true
    editable: true
Create monitoring/grafana/provisioning/dashboards/dashboard.yml:
apiVersion: 1

providers:
  - name: 'vLLM Dashboards'
    orgId: 1
    folder: ''
    type: file
    disableDeletion: false
    updateIntervalSeconds: 10
    allowUiUpdates: true
    options:
      path: /var/lib/grafana/dashboards
Step 5: Docker Compose Setup
Create docker-compose.monitoring.yml:
services:
  prometheus:
    image: prom/prometheus:latest
    container_name: vllm-prometheus
    ports:
      - "${PROMETHEUS_PORT:-9090}:9090"
    volumes:
      - ./monitoring/prometheus/prometheus.yml:/etc/prometheus/prometheus.yml
      - ./monitoring/prometheus/rules:/etc/prometheus/rules
      - prometheus_data:/prometheus
    env_file:
      - monitoring.env
    environment:
      - VLLM_API_KEY=${RUNPOD_API_KEY}
    command:
      - '--config.file=/etc/prometheus/prometheus.yml'
      - '--storage.tsdb.path=/prometheus'
      - '--storage.tsdb.retention.time=200h'
      - '--web.enable-lifecycle'
    restart: unless-stopped
    networks:
      - monitoring

  grafana:
    image: grafana/grafana:latest
    container_name: vllm-grafana
    ports:
      - "${GRAFANA_PORT:-3000}:3000"
    volumes:
      - grafana_data:/var/lib/grafana
      - ./monitoring/grafana/provisioning:/etc/grafana/provisioning
      - ./monitoring/grafana/dashboards:/var/lib/grafana/dashboards
    env_file:
      - monitoring.env
    environment:
      - GF_SECURITY_ADMIN_USER=${GRAFANA_ADMIN_USER:-admin}
      - GF_SECURITY_ADMIN_PASSWORD=${GRAFANA_ADMIN_PASSWORD:-admin123}
      - GF_USERS_ALLOW_SIGN_UP=false
      - GF_INSTALL_PLUGINS=grafana-clock-panel
    restart: unless-stopped
    networks:
      - monitoring

volumes:
  prometheus_data:
  grafana_data:

networks:
  monitoring:
    driver: bridge
Step 6: Launch the Stack
docker-compose -f docker-compose.monitoring.yml up -d
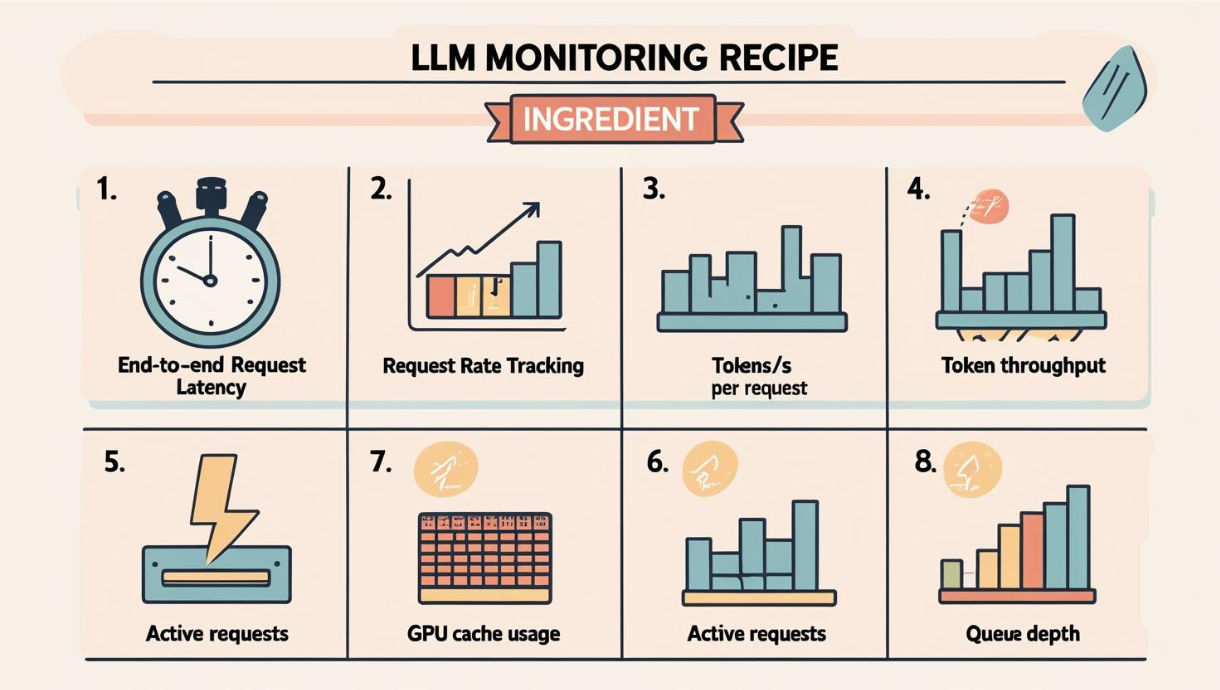
Key Dashboard Panels
- End-to-End Request Latency
- Request Rate Tracking
- Token/s per request
- Token Throughput
- Time to First Token
- GPU Cache Usage
- Active Requests
- Queue Depth
Real-World Insights from Dashboard Screenshots
Based on the dashboard screenshots and monitoring data, here are key patterns you'll observe:
Performance Patterns
- Latency Spikes: P99 latency often shows spikes during high load periods
- Throughput Correlation: Token generation rate correlates with request complexity
- Resource Usage: GPU cache usage patterns help optimize batch sizes
- Error Detection: Failed request spikes indicate potential issues
Optimization Opportunities
- Batch Size Tuning: Monitor cache usage to optimize batch configurations
- Model Selection: Compare latency across different model variants
- Scaling Decisions: Use request rate trends for capacity planning
- Performance Debugging: Correlate latency spikes with resource usage
Troubleshooting Common Issues
No Metrics Appearing
- Check vLLM metrics endpoint:
curl -H "Authorization: Bearer your-api-key" \
https://your-endpoint/metrics- Verify Prometheus targets: Visit
http://localhost:9090/targets - Check authentication: Ensure API key is correct in
monitoring.env
Connection Issues
- Verify endpoint URL: Ensure the vLLM server URL is accessible
- Check network connectivity: Test from the monitoring host
- Review Docker logs:
docker logs vllm-prometheus
Dashboard Not Loading
- Wait for initialization: Grafana can take 1-2 minutes to start
- Check Grafana logs:
docker logs vllm-grafana - Verify datasource: Check Prometheus connection in Grafana settings
Conclusion
Setting up comprehensive monitoring for vLLM doesn't have to be complex. With this Prometheus and Grafana stack, you get:
- Professional-grade monitoring with minimal setup effort
- Real-time insights into performance and resource usage
- Scalable architecture that grows with your deployment
- Industry-standard tools with extensive community support
The monitoring setup described here provides the foundation for understanding your vLLM deployment's behavior, optimizing performance, and ensuring reliable service delivery. Whether you're running a single model or managing multiple deployments, this monitoring stack gives you the visibility needed for operational excellence.
Start with this basic setup, then expand with custom dashboards, alerting rules, and additional metrics as your monitoring needs evolve. The investment in proper observability pays dividends in system reliability, performance optimization, and operational confidence.
Resources
Ready to monitor your vLLM deployment? Download the complete monitoring stack configuration and get started in minutes!
Want receive the best AI & DATA insights? Subscribe now!
• Latest new on data engineering
• How to design Production ready AI Systems
• Curated list of material to Become the ultimate AI Engineer